The chart in forex refers to price charts that are showing the historical price of each currency pair. It can graphically depict the historical behavior of a currency across multiple time frames. Forex charts can be accessed online through trading platforms.
Generally, there are three types of chart patterns that are often used in forex: the line chart, the bar chart, and the candlestick chart.
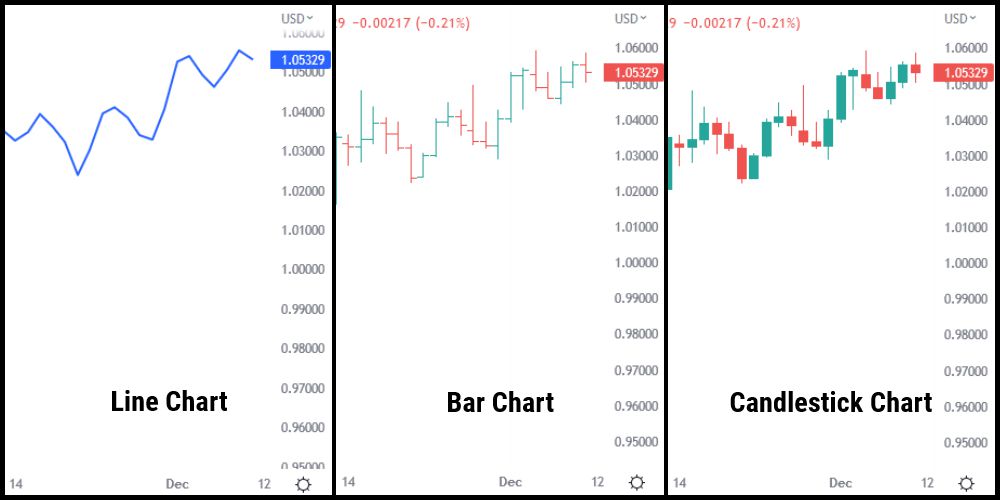
A line chart, just like the name suggests, is a simple line connecting one closing price to the next one. A bar chart is more complex as it shows the opening and closing prices as well as the highs and lows. Meanwhile, candlestick chart has the same components as bar charts but with better visuals and is easier to read.