Candlestick is a type of price chart that was originally developed by a Japanese trader more than 100 years ago. It was introduced to the modern financial market by Steve Nison through his book which was published in 1991.
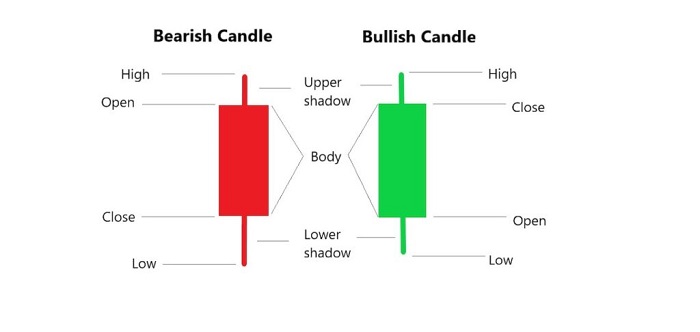
Each candle consists of a 'body' that sometimes has a wick or tail. It can show the market's Open, High, Low, and Close prices for a certain period of time. Interestingly, Candlestick's body is usually filled with colors that depend on the market condition. This makes it easier for traders to analyze price patterns using the candlestick chart. Below is the anatomy of bearish and bullish candlesticks.
Compared to other charts in forex trading, candlestick becomes the most well-known due to its clarity in showing market sentiments. The components of the candlestick chart (body and wick) have made it possible to form many different patterns that can be interpreted as bullish or bearish signals, reversal or continuation signals, and even breakout or pullback signals. This is certainly a more advanced function than the other popular forex charts. In that case, the line chart only shows the ups and downs of a currency pair and the bar chart doesn't have a solid body to read.