Mistakes in Using Fibonacci Retracement
Fibonacci Retracement is one of the most frequently used technical indicators in trading. Despite its popularity, there are four common mistakes in applying Fibonacci Retracement that traders must understand to avoid unnecessary losses.
Fibonacci retracement levels are widely utilized across various financial markets, including forex, equities, commodities, and futures. Some traders rely on this tool consistently, while others apply it selectively. Regardless of frequency, the key factor lies in correct application. Inaccurate placement or interpretation of Fibonacci retracement levels can lead to imprecise entry and exit points, ultimately undermining trading performance.
This article reviews four critical mistakes in using Fibonacci Retracement that should be avoided, particularly in forex trading. By understanding these common pitfalls, traders—especially beginners—can reduce analytical errors and improve the quality of their technical analysis.
1. Using Inconsistent Reference Points
Retracement represents a corrective move within an existing trend. According to Fibonacci theory, each retracement level—derived from specific ratio values—acts as a potential support or resistance zone that can be used as a reference for trade entries or exits. These retracement levels are determined using reference points known as the swing high and swing low.
The swing high represents the highest reference point, while the swing low represents the lowest. These reference points can be determined either by using the closing price of the candlestick bar (the body) or the extreme price (the wick).
If a trader chooses to use the closing price of the candlestick bar as the swing high reference, then the swing low must also be drawn from a closing price. Similarly, if the swing high is taken from the highest wick of the candlestick, the swing low must be taken from the lowest wick. Mixing these two methods should be avoided.
Consistency is essential. Traders must apply a body-to-body or wick-to-wick approach when drawing Fibonacci retracement levels. Below are examples of correct and incorrect reference point determination:
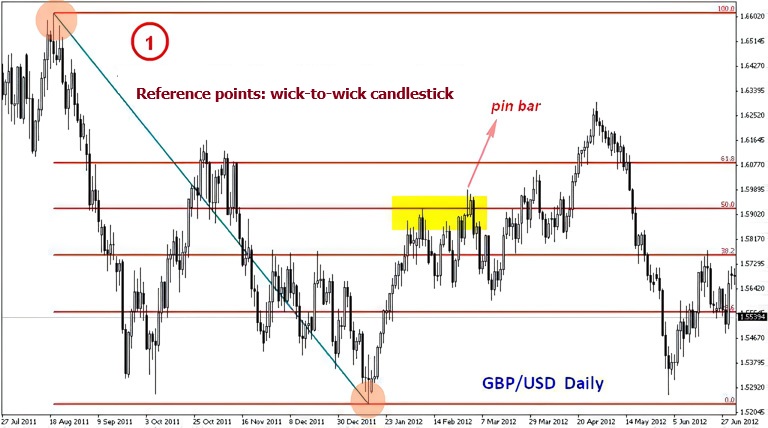
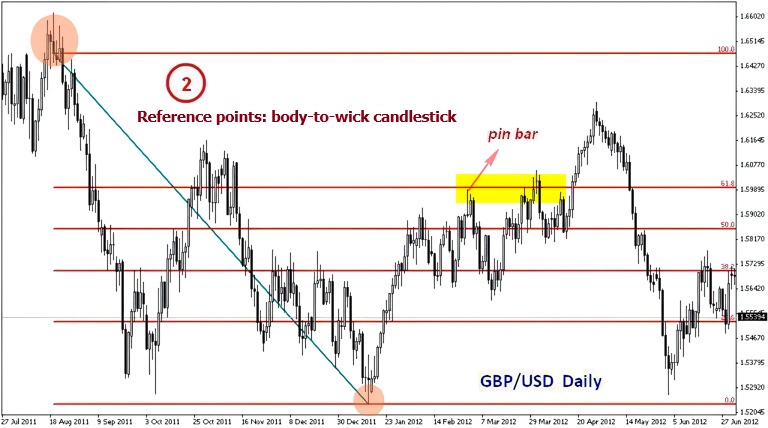
In the GBP/USD daily chart above, when the swing high and swing low are drawn from wick to wick (highest price to lowest price), resistance appears at the 50% retracement level, around 1.5925. Meanwhile, when body-to-wick reference points are used (closing price of the upper bar to the lowest wick of the lower bar), resistance emerges at the 61.8% retracement level, near 1.6000.
While support and resistance levels are inherently relative and not absolute, the choice of reference points has practical implications. In example (2), traders may need to wait nearly two additional weeks to confirm resistance compared to example (1). Moreover, in example (1), a sell signal becomes available earlier when the pin bar rejection at the 50% Fibonacci level is confirmed, whereas example (2) may still require further confirmation.
Although real market behavior may not always mirror these scenarios exactly, maintaining consistent reference points when applying Fibonacci Retracement significantly improves the reliability of support and resistance identification. Traders may also experiment with using closing prices consistently (body-to-body) to suit their trading style.
2. Ignoring the Long-Term Trend
The long-term trend is best identified on a higher timeframe. When using Fibonacci Retracement, traders are strongly advised to assess the prevailing trend on a higher timeframe—unless they are already trading exclusively on higher timeframes. This step is critical to avoiding long-term trend misalignment, which can result in suboptimal trade outcomes or outright losses.
Consider the following example using NZD/USD on both the Daily and 1-hour charts, taken during the same trading period:
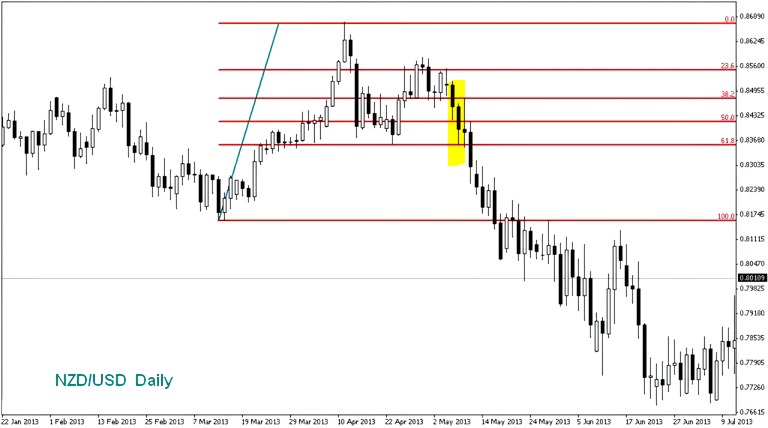
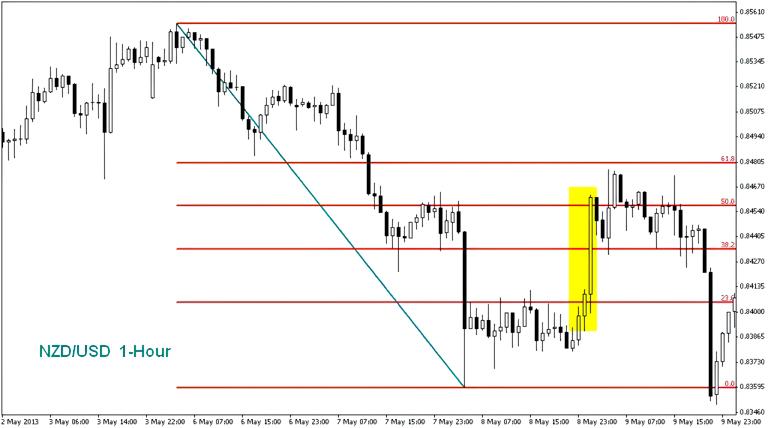
If you trade during the days of May 8-9, 2013, on the Daily (D1) timeframe, you are very likely to enter a sell order at levels between 0.8450 and 0.8400 after the Fibonacci retracement support levels of 38.2% and 50% are broken. Additionally, the appearance of a Doji candlestick pattern and rejection at the Fibonacci retracement level of 23.6% is also a strong reversal signal.
However, trading the same period on the 1-hour timeframe would likely lead you to enter a buy position around 0.8410–0.8435, following the breakout of the 23.6% and 38.2% Fibonacci retracement resistance levels. The formation of a bullish morning star pattern provides additional confirmation for a long position.
With the 1-hour timeframe, you can gain about 50-60 pips, but this profit cannot be compared to the 500-600 pips you could achieve by following the main trend on the Daily timeframe.
3. Not Using Additional Indicators as Confirmation Tools
To avoid mistakes due to misidentifying momentum when entering a trade, you can apply an additional indicator to confirm Fibonacci retracement levels. Commonly used indicators are Oscillators (MACD, Stochastic, or RSI). Let’s look at the following example:
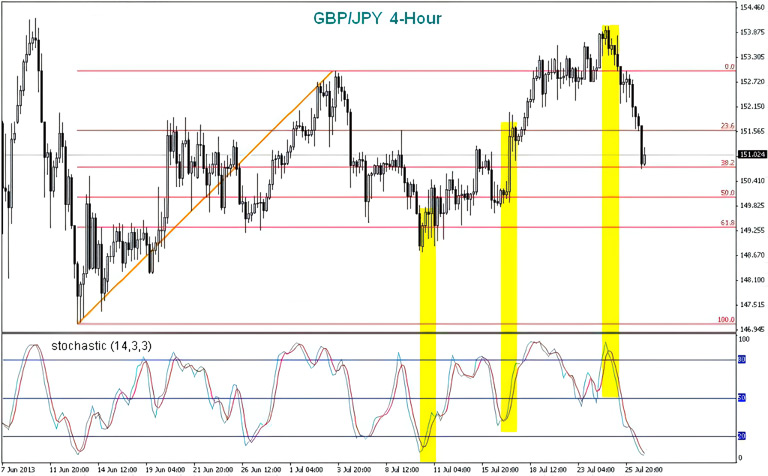
As shown in the example above, entry accuracy improves when trades are initiated at the point where the %K and %D lines of the Stochastic Oscillator intersect. These crossovers—especially when combined with overbought or oversold conditions near key Fibonacci levels—provide stronger momentum confirmation.
To better understand how to use this indicator, you can practice on a demo account. Once you are confident and fully understand how to use this indicator correctly, you can apply it to a real account.
4. Using a Very Low Timeframe
Extremely low timeframes, such as the 1-minute chart, are dominated by market noise and unreliable signals. These timeframes exhibit high volatility, which significantly reduces the accuracy of Fibonacci retracement support and resistance levels. Additionally, as discussed in point (2), low timeframes increase the risk of trend misinterpretation.
Another challenge is defining meaningful exit levels, as price movements on very low timeframes are often limited in pip value. As a result, applying Fibonacci Retracement on such timeframes can be both inefficient and risky.
For this reason, Fibonacci Retracement is generally less suitable for scalping strategies. Instead, it is better suited for trend-following traders who seek to capitalize on price corrections within established market trends.
Conclusion
In summary, below are 4 common mistakes in using Fibonacci and what you can learn from these mistakes:
| Mistake | Why to Avoid | How to Fix |
| Using inconsistent reference points. | Reduce the accuracy of Fibonacci-based support and resistance. | Use consistent reference points—either body-to-body or wick-to-wick—when drawing Fibonacci lines. |
| Ignoring long-term trends. | Lead to misinterpretation and mistaken trades where they do not align with the main trend. | Always compare the current trading timeframe with a higher timeframe before entering a position. |
| Not using additional indicators | Lack of confirmation increases the risk of false entries. | Incorporate oscillator-type indicators to confirm entry momentum. |
| Using a very low timeframe | Low timeframes contain excessive noise and unreliable signals. | Apply Fibonacci Retracement on higher timeframes, preferably 4-hour or above. |
Beyond Fibonacci Retracement, traders may also consider using Fibonacci Time Zones to anticipate potential trend reversals. Fibonacci Time Zones help identify periods when price reversals are more likely to occur. When combined with other analytical tools such as support and resistance or supply and demand, overall trading accuracy can be further enhanced.