Fibonacci in Forex: Key Concepts and Applications
Where does Fibonacci originate, and how is Fibonacci analysis applied in forex trading? This article provides a comprehensive review of Fibonacci analysis, from its historical roots to its practical application in the foreign exchange market.
The Fibonacci sequence is a series of numbers widely used in various fields, including financial trading. In the forex market, Fibonacci analysis is primarily associated with Fibonacci Retracement, a popular technical tool for identifying potential support and resistance levels.
The Origin of Fibonacci
The Fibonacci sequence was formally introduced by an Italian mathematician named Leonardo Pisano (1175–1250) in his seminal work on the Hindu-Arabic numeral system, Liber Abaci (The Book of Calculation). The name "Fibonacci" itself was later attributed to him by a French historian, Guillaume Libri. The term is derived from filius Bonacci, meaning "son of Bonacci," referencing his father, Guglielmo Bonacci. Over time, the name Leonardo Fibonacci became widely recognized, and it is from this name that the Fibonacci sequence derives its modern designation.
It is important to note that the Fibonacci sequence was not originally discovered by Leonardo Fibonacci. Similar numerical patterns had been studied much earlier by Indian mathematicians, particularly in relation to Sanskrit prosody and poetic meter. However, Leonardo Fibonacci played a crucial role in introducing the sequence to the Western world through Liber Abaci, alongside foundational mathematical concepts such as zero, decimals, fractions, and the positional numeral system that underpin modern arithmetic.
Fibonacci Sequence and the Golden Ratio
In Liber Abaci, Leonardo Fibonacci described a numerical sequence in which, after the initial values of 0 and 1, each subsequent number is the sum of the two preceding numbers. The sequence therefore progresses as follows:
0, 1, 1, 2, 3, 5, 8, 13, 21, 34, 55, 89, 144, 233, 377, 610, and so on, extending indefinitely.
A notable mathematical characteristic of this sequence is that each number is approximately 1.618 times greater than the preceding number. This ratio, known as Phi or the Golden Ratio, is mathematically represented as 1.618, with its inverse being 0.618.
The Golden Ratio has long been associated with natural structures, architectural proportions, and artistic compositions. It is often cited in analyses of masterpieces such as Leonardo da Vinci's Mona Lisa, Katsushika Hokusai's The Great Wave off Kanagawa, and the Parthenon in Greece. Beyond art and architecture, the ratio is observed in sunflower seed arrangements, snail shells, human facial proportions, and even spiral galaxy formations. Many artists and scientists regard the Golden Ratio as a representation of visual and structural harmony.

In financial trading, however, Fibonacci is not applied based on the absolute values of the sequence itself, but rather on the proportional relationships between the numbers. For example, dividing 89 by 144—the next number in the sequence—yields approximately 0.618, or 61.8%. Dividing 89 by the second subsequent number produces approximately 0.382, or 38.2%. These proportional relationships form the basis of Fibonacci levels used in technical analysis.
When applied to price charts, these Fibonacci-derived ratios frequently align with key price reaction points. As a result, Fibonacci has become a widely adopted tool in forex trading as part of technical market analysis.
Types of Fibonacci in Forex Analysis
Fibonacci analysis in forex trading is primarily centered on Fibonacci Retracement, which can be expanded into Extensions and other derivative tools. Below is an overview of the most commonly used Fibonacci tools in forex analysis:
| Type of Fibonacci | Description | Main Levels |
|
Fibonacci Retracement |
Used to identify potential support or resistance levels during a price correction in an ongoing trend. | 23.6%, 38.2%, 50%, 61.8% and 78.6% |
| Fibonacci Extension | Used to project price targets in the direction of the prevailing trend; commonly applied to define take-profit levels and estimate potential price expansion beyond the initial trend movement. | 100%, 127.2%, 161.8%, 200% and 261.8% |
| Fibonacci Fan | Diagonal trendlines derived from Fibonacci ratios. Useful for identifying dynamic support and resistance zones, assessing trend direction, and anticipating potential reversal areas. | - |
| Fibonacci Time Zone | Vertical lines based on Fibonacci numerical intervals, designed to forecast potential timing of price reversals. | - |
| Fibonacci Arc | Arc-shaped curves drawn from Fibonacci ratios, used to visualize potential support and resistance levels, correction zones, and cyclical price behavior. | - |
Applying Fibonacci Analysis in Forex
Despite the availability of multiple Fibonacci tools, this learning material focuses exclusively on Fibonacci Retracement, as it is the most widely used and the easiest for traders to understand and apply.
Fibonacci Retracement levels are derived from proportional measurements between price extremes, incorporating ratios such as 23.6%, 38.2%, and 61.8%, along with the 50.0% (0.500) level. Although the 50% level is not mathematically derived from the Fibonacci sequence, it has long been regarded as a significant retracement zone within Dow Theory and the analytical work of renowned technical analyst W.D. Gann.
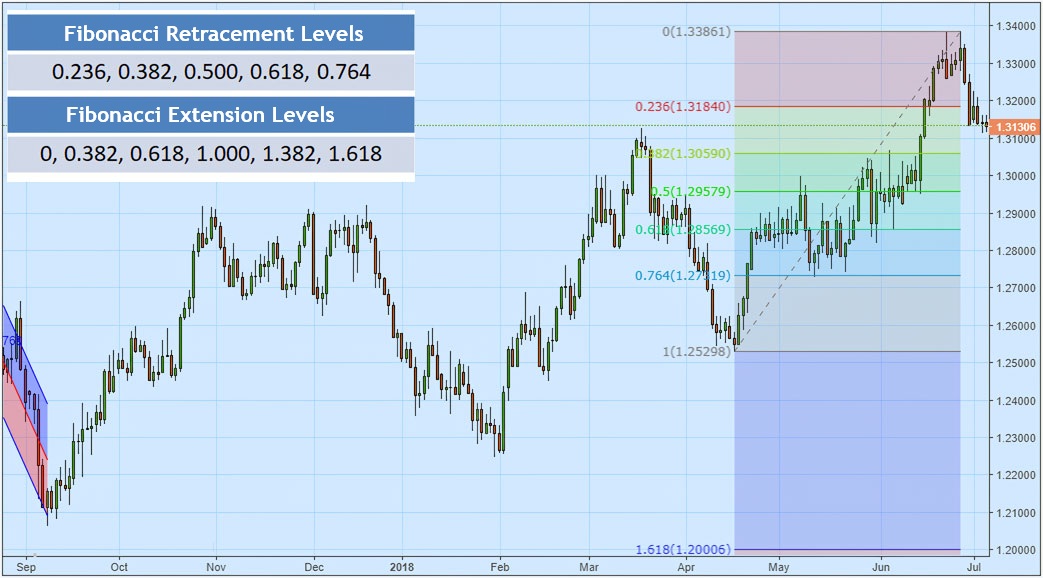
By observing the chart above, it becomes evident that Fibonacci Retracement levels frequently coincide with historical price reversal zones. While this phenomenon may be difficult to explain from a purely scientific standpoint, its repeated occurrence across markets has reinforced Fibonacci’s credibility among technical traders.
How to Draw Fibonacci Lines
To correctly apply Fibonacci Retracement, you can follow these steps:
1. Mark the highest price (High) or the lowest price (Low) on the chart.
This may seem easy, but it requires sensitivity to market structure and alignment with your methodology. In the example chart below, several High and Low points are visible at first glance.
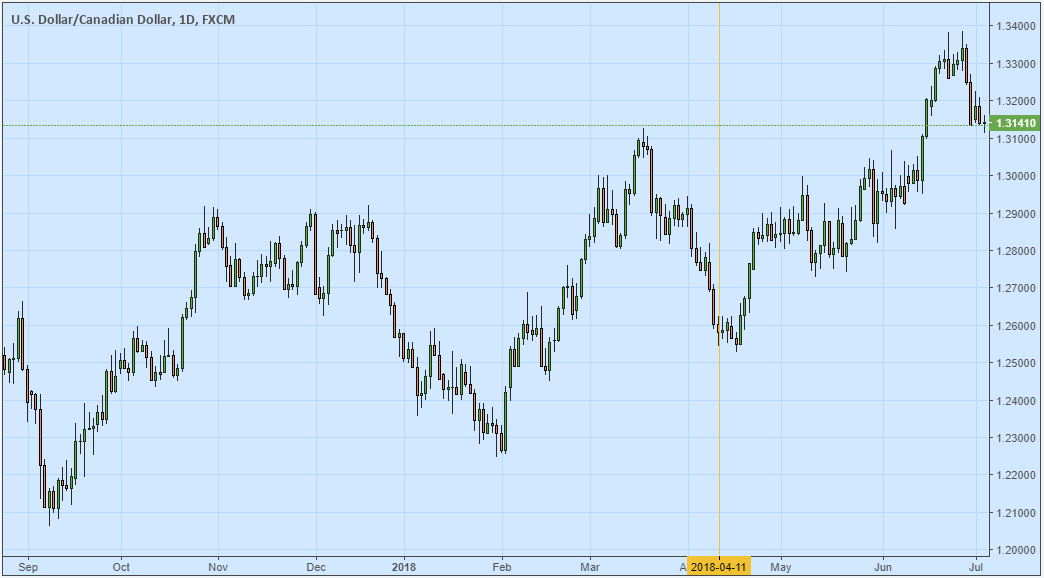
To standardize the process, you may limit the measurement to a fixed number of recent candles—for example, the last 60 candles, as indicated by the gold vertical line. This approach confines the Fibonacci measurement to the most relevant price action.
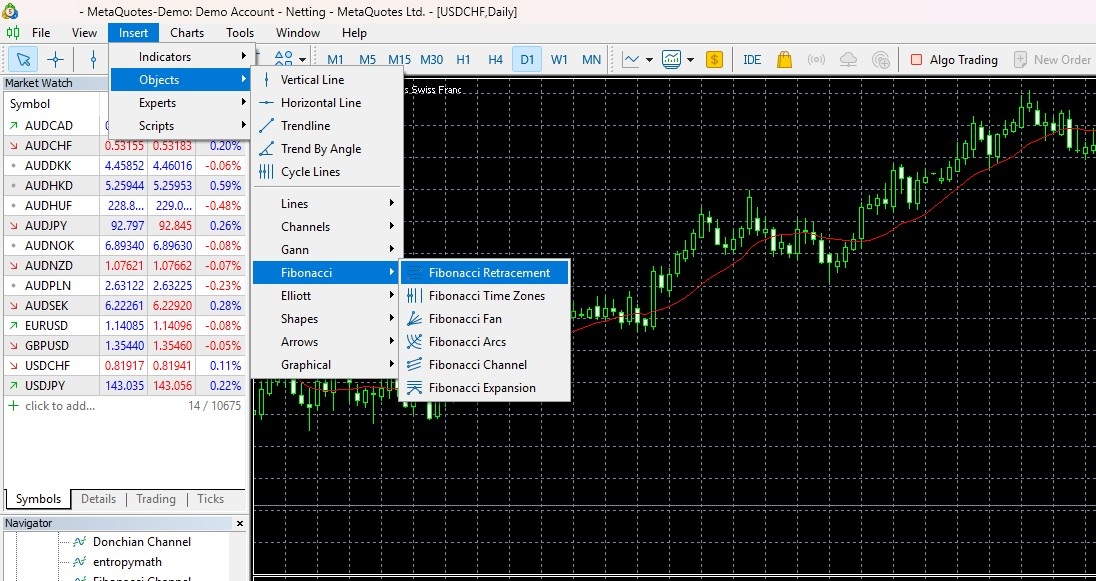
2. Find the tool to draw Fibonacci Retracement on the platform.
If you're using MetaTrader, this tool is usually found in the Menu Bar. You can find it in the Insert → Objects → Fibonacci → Fibonacci Retracements.
3. Draw Fibonacci Retracement from left to right.
Click on the High or Low point on the left side of the chart, then click again on the corresponding High or Low point on the right side. It is essential to draw Fibonacci Retracement from left to right, whether measuring a retracement in a downtrend (top to bottom) or an uptrend (bottom to top). The resulting chart appears as follows:
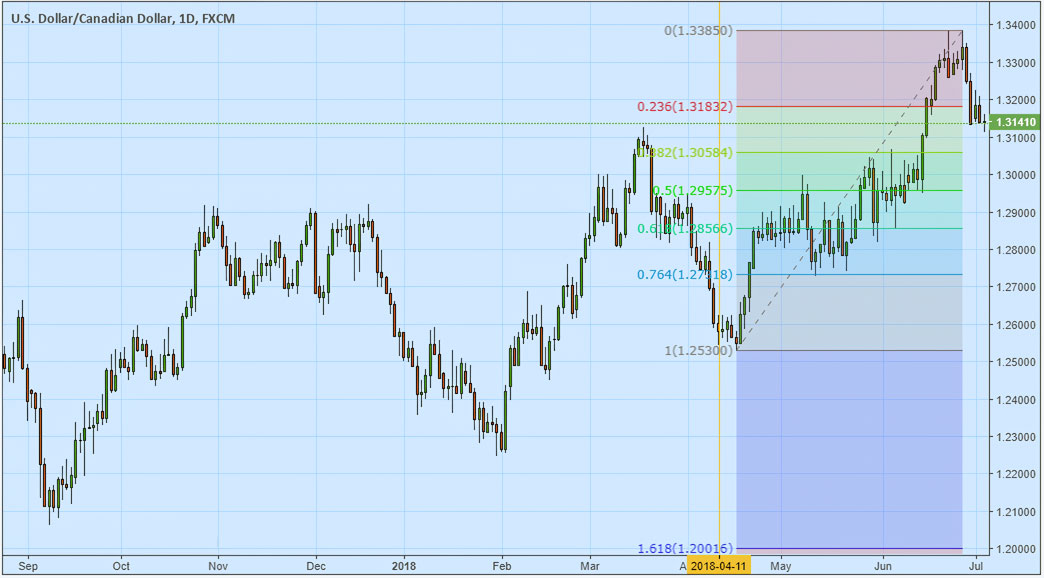
USD/CAD Daily chart with Fibonacci Retracement during an uptrend.
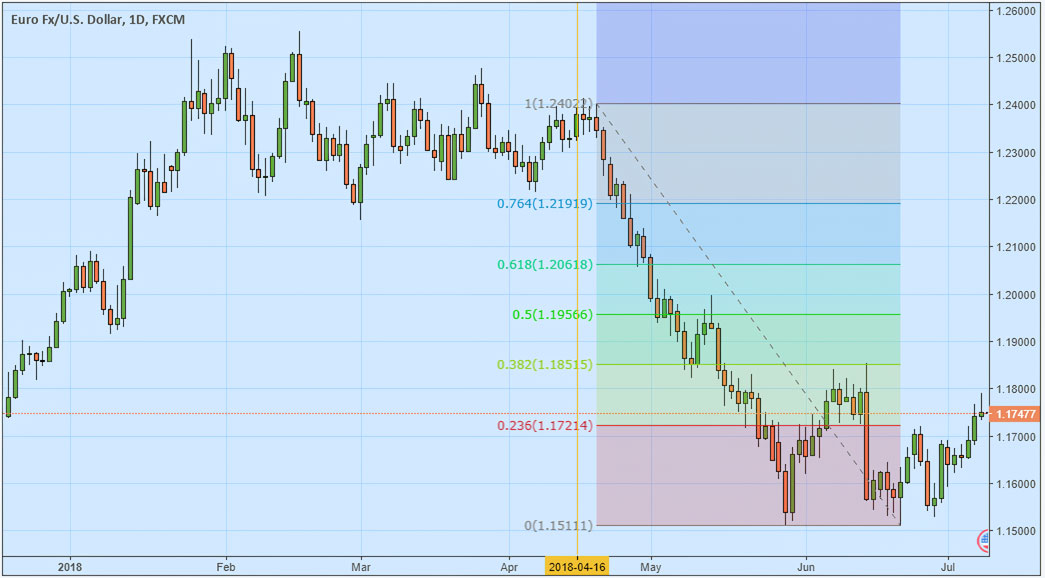
EUR/USD Daily chart with Fibonacci Retracement during a downtrend.
How to Utilize Fibonacci for Trend Trading
Fibonacci Retracement is primarily used to identify support and resistance levels and is most effective when combined with a broader trend-following strategy or additional technical indicators. One of the simplest and most commonly used approaches is to integrate Fibonacci Retracement with trend analysis. The steps are as follows:
- Identify the prevailing market trend. In the example below, the price action demonstrates a clear downward (bearish) trend. Under such conditions, traders typically seek selling opportunities when the price temporarily retraces higher.
- Plot key Fibonacci Retracement levels, particularly 23.6% (0.236), 38.2% (0.382), and 61.8% (0.618). These horizontal levels act as potential reversal zones.
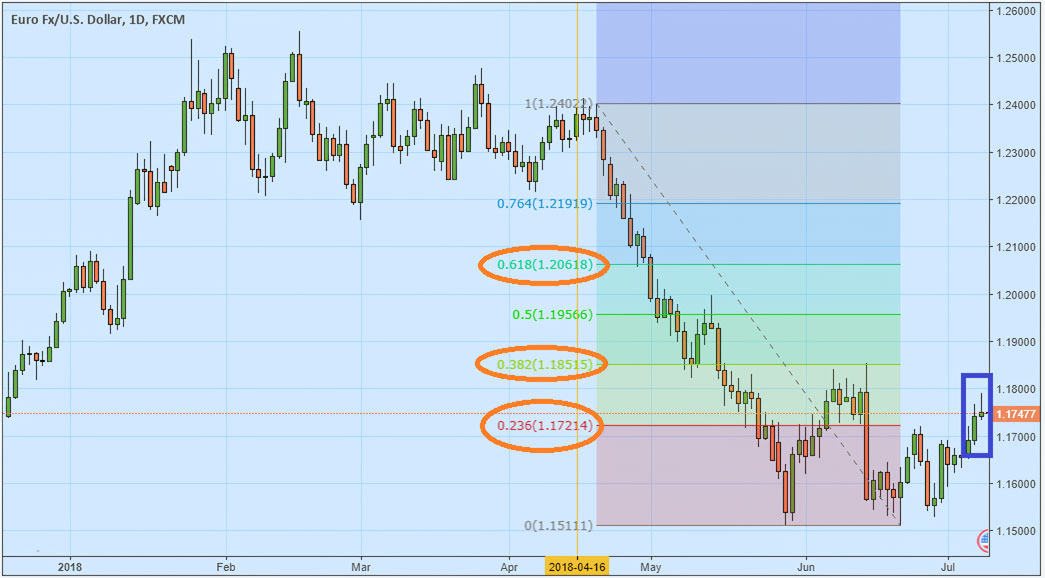
- Observe candle closing prices near Fibonacci levels. Note:
-
If price retraces to the 0.236, 0.382, or 0.618 level and a candle closes below that level, the market is likely to resume its downward movement, potentially toward the next Fibonacci level. A sell position may be considered if confirmed by other technical indicators.
-
If the price closes above a Fibonacci level, it suggests continued upward momentum. However, given that the broader trend remains bearish, initiating buy positions is generally discouraged unless additional indicators signal a meaningful trend reversal.
-
Finally, you need to remember that the main function of Fibonacci in forex is to identify potential support and resistance zones. While Fibonacci Retracement levels often align remarkably well with historical price turning points, their effectiveness is significantly enhanced when used in conjunction with complementary tools such as Moving Averages, candlestick pattern analysis, or other technical indicators.