How to Trade with Fibonacci Retracement
Forex trading3 Answer
@ Herli:
Fibonacci levels, both retracement (FR) and expansion (FE), indicate support and resistance considered quite accurate and can be used as benchmarks for entry and exit levels.
For example, on the current EUR/USD daily time frame: (see also: Major Forex Pair Technical Analysis: April 25 - May 2, 2018):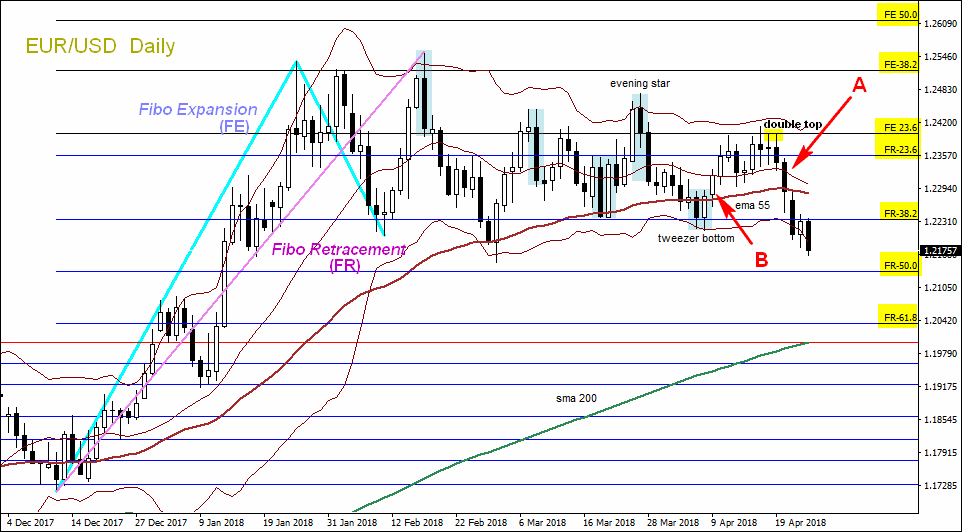
It appears a double top pattern is forming at the FE 23.6 level, suggesting a bearish move. You can sell at A after the price breaks the middle band curve of the Bollinger Bands, with a target profit (TP) at the FR 38.2 level. At least 50 pips can be obtained.
After failing to break the FR 38.2 resistance level, you can also sell again with a TP at the FR 50 level.
Also, in the previous movement, after forming a tweezer bottom pattern at the FR 38.2 level, suggesting a bullish move, you can buy at B after the price breaks the resistance curve of the ema 55, with a target profit at the FR 23.6 or FE 23.6 level.
Regarding the time frame, both Fibonacci retracement, expansion and Fibonacci fan, can work well on all time frames. However, the higher the time frame you use, the more accurate it will be.
Also read the forum Q&A about Fibonacci here.
@ Herli:
It is possible, but often less accurate or frequently misses because almost all technical indicators calculated mathematically are lagging or late in responding to price changes. The calculation is done after the price moves, so it is always late. But statistically, indicators can be used to predict the direction of price movement.
Candlestick patterns or price action are leading (the opposite of lagging) so they can predict the direction of market sentiment faster than technical indicators.
Traders usually combine price action and indicators. Price action to determine the direction of market sentiment while indicators to confirm and find the right momentum for entry.
Add Answer
Forum Fibo
view all-
How to use the Fibo line
Technical Analysis5 Year ago
-
How to interpret Fibo
Broker review4 Year ago
-
How to Draw Fibonacci Retracement
Technical Analysis5 Year ago
-
How to Trade with Fibonacci Retracement
Forex trading8 Year ago
-
How to remove installed fibo
Technical Analysis12 Year ago
-
How to draw a correct fibo line
Technical Analysis5 Year ago
Testimonials Fibo
view all-
This broker is honest and comprehensive. They accepted my payment...
6 Year ago
-
I trade with Fibo Group last few months. Fibo has...
6 Year ago
-
Crypto currency mining super hash power has really been an...
6 Year ago
-
Be careful of a fraudulent institution. If you make money,...
6 Year ago
-
They claimed that thaye have no requotes, but I have...
6 Year ago
News Fibo
view all-
Forex Broker FIBO Releases CySEC License
8 Month ago
-
Get Free Deposits at FIBO Forex Broker
2 Year ago
-
HF Markets Webinar Reveals the Secrets of Fibonacci Theory
3 Year ago
-
FIBO Group Plans Expansion into Latin American Markets in 2023
3 Year ago
-
FIBO Group Introducing New Payment Methods
7 Year ago
-
Fibo Group Introduces MT5 Web
7 Year ago
Article Fibo
view all-
Mistakes in Using Fibonacci Retracement
Forex School Tradesmart
-
Combining Fibonacci and RSI in Forex Trading
Forex School Tradesmart
-
Fibonacci in Forex: Key Concepts and Applications
Forex School Tradesmart
-
Deposits and Withdrawals on FIBO
Other Axella Pips
-
Guide to Opening a Trading Account at FIBO
Other Axella Pips
-
Guide to Opening a Demo Account at FIBO
Demo Accounts Axella Pips