Combining Fibonacci and RSI in Forex Trading
In this strategy, Fibonacci Retracement is used to identify support and resistance levels, while the RSI indicator serves as a confirmation tool.
This article outlines the application of a combined technical approach in forex trading using two widely followed indicators: Fibonacci Retracement levels and the Relative Strength Index (RSI) oscillator. Fibonacci Retracement is primarily employed to identify potential support and resistance zones, while the RSI functions as a momentum-based confirmation indicator. When applied together, this strategy can be implemented across all trading timeframes and is designed to maintain a minimum Risk/Reward ratio of 1:2.
RSI Complementing Fibonacci Retracement
Fibonacci Retracement is commonly used by forex traders to locate potential hidden support and resistance levels—areas where price corrections or breakouts frequently occur. Key retracement levels monitored by market participants include 23.6%, 38.2%, 50.0%, and 61.8%, which are collectively referred to as Fibonacci ratios. Among these, the 50.0% and 61.8% levels are often considered the most critical, as price action tends to show stronger reactions around these zones.
For traders who are new to Fibonacci Retracement theory, a common question arises regarding which levels should be prioritized and how to determine whether price reactions at those levels represent temporary corrections or genuine breakouts.
This concern is well-founded, as Fibonacci Retracement levels on their own only highlight potential support and resistance zones. To better assess the quality and direction of price reactions, traders need to integrate additional analytical tools, such as price action formations reflected in specific candlestick patterns, or technical indicators that measure momentum and strength.
One challenge frequently encountered is that on timeframes below four hours—such as the 1-hour (H1) or 30-minute (M30) charts—traders are more susceptible to false signals when relying solely on price action or candlestick patterns. As such, many traders incorporate the RSI indicator as a confirmation tool when trading below the Daily (D1) timeframe.
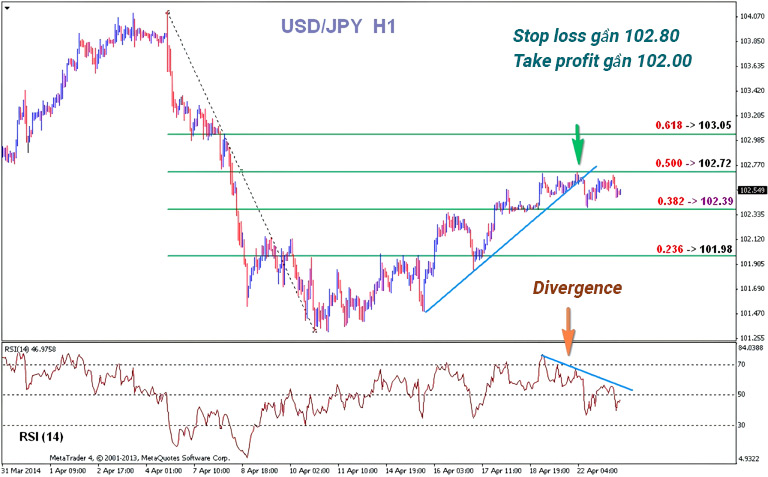
It can be seen on the chart that:
- The 23.6% Fibonacci Retracement level acted as a strong resistance area before eventually being breached.
- The 38.2% retracement level functioned as both a strong resistance and a strong support zone.
- The 50.0% Fibonacci level also successfully held price movement, indicating its technical significance.
A key feature to note is the presence of divergence between price action and the RSI indicator. Divergence is a well-known trading signal and is widely used as a confirmation mechanism prior to entering a position.
When price action forms a Higher High (HH) while the RSI simultaneously prints a Lower High (LH), it suggests that bullish momentum is weakening near a resistance level. This loss of momentum is visually represented by the distance marked between the orange arrow and the green arrow on the chart. Such conditions typically provide a favorable setup for initiating a sell order.
In this scenario, a Stop Loss can be placed several pips above the 50.0% Fibonacci Retracement level, while Take Profit may be targeted toward the psychological support level around 102.00. In addition, traders should ensure that the Risk/Reward ratio exceeds 1:1, optimizing it wherever possible to enhance long-term profitability.
Trading Tips When Using the Fibonacci and RSI Combination
- Combine with candlestick patterns: Seek additional confirmation from reversal candlestick formations such as Pin Bars, Doji, or Engulfing patterns, particularly when they form near key Fibonacci levels.
- Pay attention to the primary trend: Always check the overall trend on a larger timeframe before drawing Fibonacci on a smaller timeframe.
- Avoid sideways market: Since this strategy relies on divergence as a reversal signal, it performs best in clearly trending markets and is less effective during range-bound or consolidating price action.
- Limit risk exposure: Apply disciplined risk management at all times. In this approach, the maximum risk per trade should not exceed 1-2% of total trading capital, in line with individual risk tolerance.