Inside XM's Exclusive Technical Indicators: Are They Worth It?
Beyond spreads and execution speed, XM promotes a suite of proprietary technical indicators—developed in collaboration with veteran trader Avramis Despotis— to give clients a structured edge in market analysis. What are they?
For more than a decade, XM broker has positioned itself as a major player in the retail trading space, offering multiple account types, broad market access, and multilingual customer support. Now, the broker also provides exclusive tools to help traders interpret trend direction, volatility, support and resistance, and timing for trade entries. They are fully compatible with both MetaTrader 4 (MT4) and MetaTrader 5 (MT5), and can even be integrated into Expert Advisors (EAs) for automated strategies.
XM's exclusive lineup includes six main tools:
- Ribbon Indicator – Identifies prevailing trends and optimal entry timing.
- River Indicator – Detects market direction and highlights instruments gaining momentum.
- Ichimoku Indicator – Maps support/resistance and clarifies trend structure.
- Bollinger Bands Indicator – Measures volatility and anticipates potential breakouts or reversals.
- ADX & PSAR Indicator – Evaluates trend strength and possible turning points.
- Analyzer Indicator – Automates multi-indicator analysis across instruments.
Each tool also features an overview table, allowing traders to scan multiple instruments without flipping between individual charts—a significant efficiency boost for active traders.
Here's a closer look at how they work, what it takes to access them, and how to assess their worth.
Ribbon Indicator
The Ribbon combines 10 moving averages across multiple timeframes, forming a layered "ribbon" that visually clarifies trend alignment.
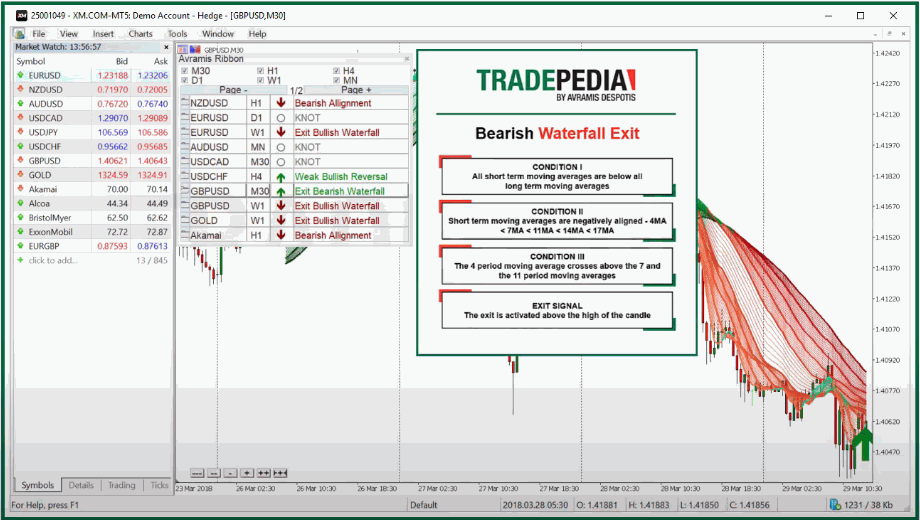
What it allows you to do:
- Trade with the trend: Price above the ribbon signals bullish momentum; below signals bearish continuation.
- Spot consolidation zones: Tight ribbon clustering often precedes breakouts.
- Identify continuation signals: Sustained positioning above/below the ribbon suggests trend persistence.
- Scan markets quickly: The overview table summarizes signals across instruments.
This XM tool performs best in clearly trending environments.
River Indicator
The River Indicator blends moving averages with measures of market momentum and price positioning.
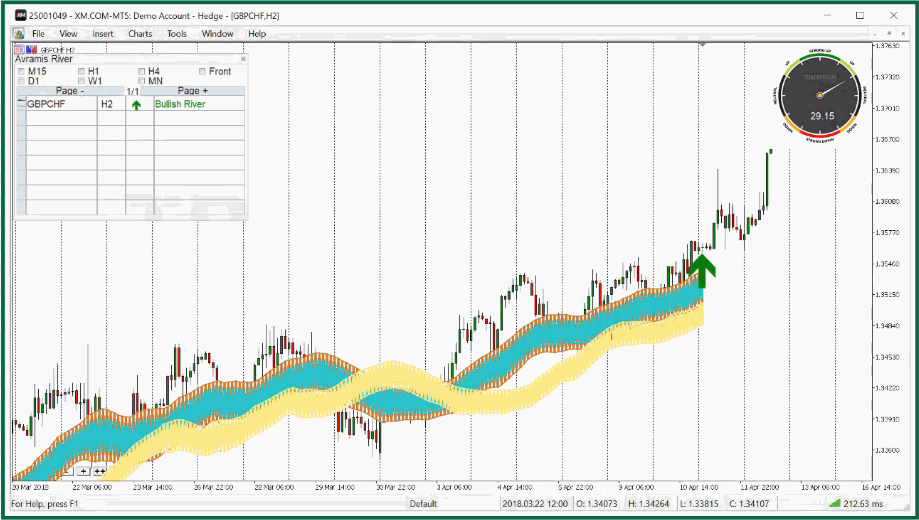
Its strengths lie in detecting range conditions, replacing multiple trend tools, and comparing multiple instruments at once. You can identify whether markets are consolidating, consolidate trend data into one streamlined interface, and learn which pairs show the strongest directional bias, all in one display of this technical tool.
It emphasizes not just trend direction, but clarity and strength.
Ichimoku Indicator
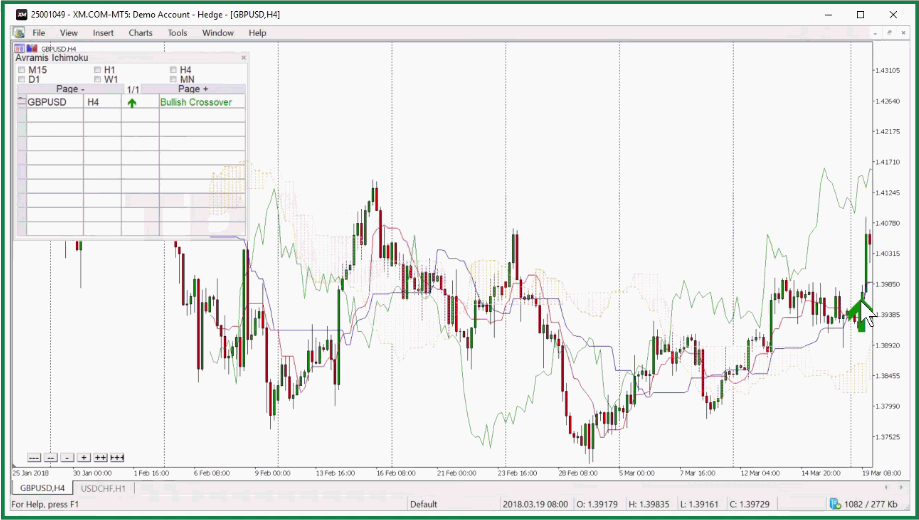
Built around the classic Ichimoku framework, this version helps traders identify strong directional markets (price clearly above or below the cloud) and use the cloud as dynamic support/resistance. For entry signals, watch Tenkan-sen, Kijun-sen, and TK crossovers.
With all the characteristics, Ichimoku combines structure, momentum, and entry timing in a single system. You can use the overview table to scan multiple instruments.
Bollinger Bands Indicator
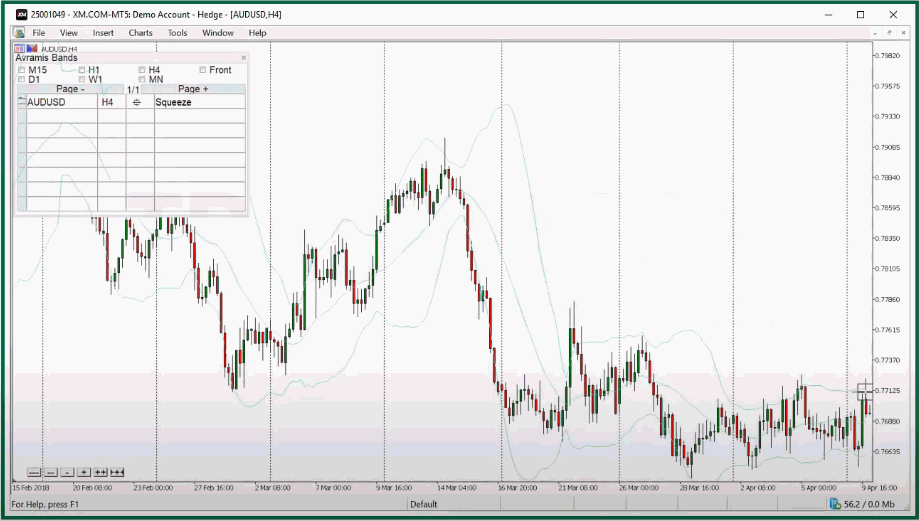
Based on volatility dynamics, XM provides this indicator exclusively for traders to:
- Spot extreme price levels when price touches or breaches outer bands.
- Trade range conditions by buying near the lower band and selling near the upper band.
- Anticipate breakout volatility when bands expand rapidly.
- Systematically scan assets through the multi-instrument overview.
- Particularly useful for both range traders and breakout traders.
ADX & PSAR Indicators
This combination merges two classic trend tools:
| ADX (Average Directional Index) → Measures trend strength |
| PSAR (Parabolic SAR) → Signals potential reversals |
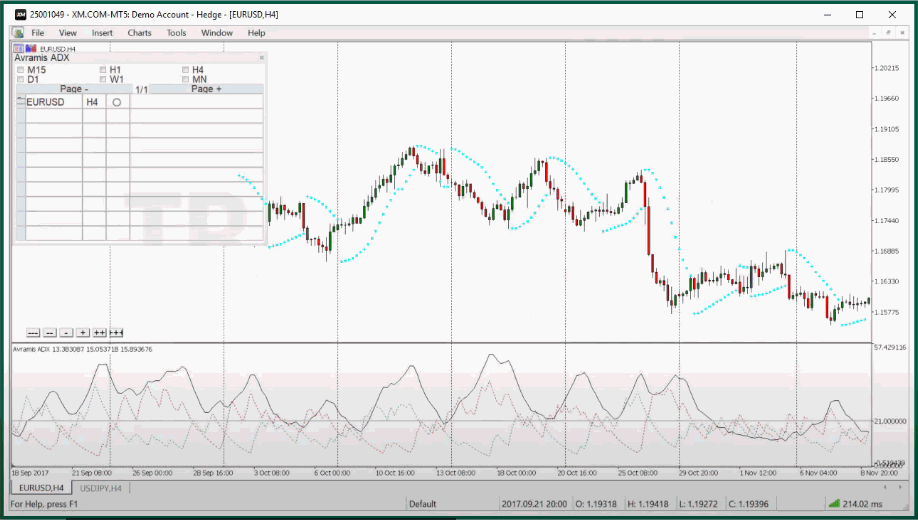
Together, they help traders identify ranging markets when ADX remains low and catch new trend formation when ADX rises while PSAR flips position. Also, overextended trends can be detected when ADX reaches extreme levels.
Using both indicators reduces the likelihood of false signals compared to standalone usage.
Analyzer Indicator
The Analyzer automates multi-indicator analysis, integrating:
- Moving Averages
- MACD
- Relative Strength Index (RSI)
- Additional technical tools
It helps you analyze in seconds instead of manually layering indicators. Real-time directional mapping of market conditions is also provided, with fast identification of favorable instruments across asset classes.
It's particularly appealing for traders who want structured, rule-based scanning.
How to Access XM's Exclusive Indicators
- Open an account via the official XM website. Navigate to Research & Education → Trading Tools.
- Click Member Login and complete the registration process.
- After account approval, expect contact from an XM Account Manager. You can request the exclusive indicators during this conversation.
- If you miss the call, you’ll typically receive follow-up contact via email or another Account Manager. Alternatively, use live chat to request assistance. Existing XM clients can contact customer service directly and ask to speak with an Account Manager.
After your request, the manager will outline the necessary steps to claim the MetaTrader indicators. Additional documentation may follow, depending on the tool requested. Traders can claim multiple tools if deposit thresholds are met.
Deposit Requirements: LITE vs PRO
Access depends on funding levels:
- $250 deposit per indicator → LITE version
- $500 deposit per indicator → PRO version
Requirements apply per account and must be met within two weeks of deposit.
| LITE | PRO |
| Usable on 1 chart | Usable on 2–3 charts |
| Standard information | Enhanced analytical insights |
| Limited functionality | Expanded features |
Final Verdict: Are The Indicators Worth It?
The strongest advantage of XM's exclusive indicators lies in usability—particularly the overview table and pop-up alerts that streamline multi-asset monitoring.
However, like any technical tool, performance depends heavily on context. Trend-based systems such as Ribbon and River excel in directional markets but can underperform in sideways conditions.
Here are the complete pros and cons of using XM's exclusive indicators:
Pros
|
Cons
|
For beginners, the structured layout and automated summaries may accelerate the learning curve. That said, committing at least $250 per indicator may not appeal to cost-conscious traders, especially given the abundance of free MetaTrader tools available.
Ultimately, the decision comes down to trading style, capital allocation, and whether the added convenience justifies the deposit commitment. If you are curious enough—and comfortable with the requirements—testing the tools firsthand may be the only way to determine their real worth of XM's exclusive indicators.