Trading Strategy with SMA 50
Dear visitors, in this note we will try to get to know the 50 SMA Trading Strategy. It is named as such because the main indicator used is the Simple Moving Average 50.
Dear visitors, in this note we will try to get to know the 50 SMA Trading Strategy. It is named this way because the main indicator used is the Simple Moving Average 50.
Indicators Used:
SMA 50
RSI 14 (20/30 - 70/80)
Daily Pivot
Time Frame:
H1 / H4
The use of TF is closely related to candlestick. If using H1, there are 24 candles in 1 trading day (Asia - London - America)
Currency Pair:
You can use any currency. However, it is better to use currencies with a sufficiently large range. Below is using GBP/USD
GBP/USD
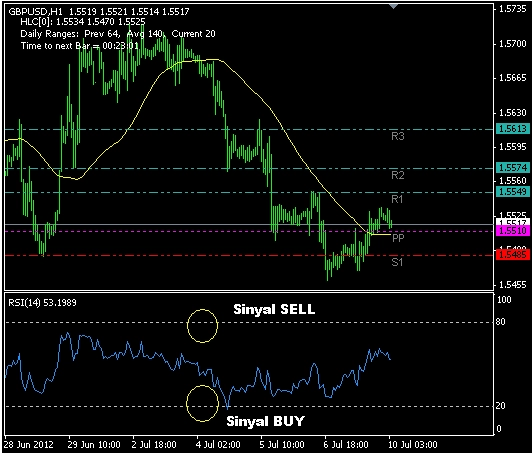
BUY Rules
If the price is at RSI 20 / 30 and is in the Support Area
SELL Rules
If the price is at RSI 70/80 and the price is in the Resistance area
Review :
Moving Average
An uptrend occurs when the price is above the SMA 50.
A downtrend occurs when the price is below the SMA 50
The use of SMA. In general, it can be used for the following purposes:
1. To determine the trend that will occur.
2. To determine support and resistance points.
3. To smooth out other indicators that are too jagged
RSI Application
RSI can be used to identify the following:
Overbought / oversold conditions
Positive / negative divergence
Price movement momentum
Daily Pivot
In this Pivot Point, the terms Pivot, Resistance, Support will be obtained
Pivot is the price movement where the price will not move too far from that point in either an upward or downward condition, it will eventually return to that price.
What is resistance? A price point where the price has difficulty breaking through a certain upper level, but if this point is breached, the price will usually be able to rise smoothly until it encounters resistance.
What is Support? A price point where the price will have difficulty breaking through a certain lower level. However, if this point is breached, the price will usually experience a significant decline until it reaches the next support point.