Multiple Time Frame Analysis in Forex Trading
Using multiple time frames allows traders to choose trading opportunities that match their comfort level and trading style.
This article explains how to analyze forex trades by combining several time frames to build a more effective strategy. By examining price movements from various perspectives, traders can more effectively determine the most suitable trading time based on their personal preferences and risk tolerance.
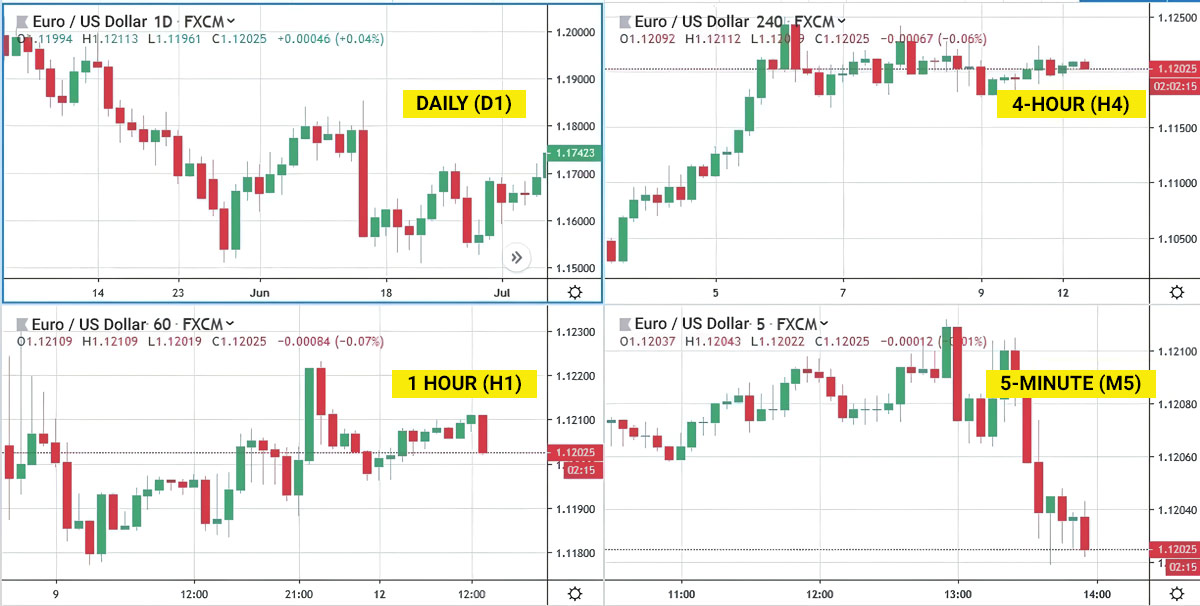
One of the most common questions among traders is, which time frame is the best for trading? The short answer is that there is no single best time frame. Every time frame can be used effectively, depending on the trader’s strategy and experience. Below is a comparison of price movements across four commonly used time frames: Daily, 4-hour, 1-hour, and 5-minute. Based on these examples, it is clear that all time frames can be used for trading under the right conditions.
Traders often form different conclusions when analyzing various time frames. This can be confusing, especially when one time frame gives a buy signal while another suggests a sell. For example, on the 1-hour chart, the price may appear to be in an uptrend, while the Daily chart shows a downtrend. In this situation, which signal should you follow?
Using multiple time frames without proper planning can lead to conflicting and unproductive signals. That is why traders need to define their main strategy first and select time frames that consistently support that strategy.
When choosing time frames, there are two basic principles that traders should understand:
- A higher time frame is used as a reference for long-term trend analysis. It helps traders see the broader market direction, understand the dominant trend, and avoid opening positions that go against the main market movement.
- A lower time frame is used to identify short-term price movements. Its main purpose is to help traders find precise entry points and take profits within a shorter period of time.
How to Analyze Using Multiple Time Frames
In many cases, traders can improve their results by analyzing several time frames at the same time. This approach helps traders confirm trading signals and gather more comprehensive information before entering the market. One well-known example of this approach is the triple screen trading strategy.
Example of Multiple Time Frame Analysis
Suppose you use the Daily and 4-hour time frames for your analysis. These time frames allow you to understand the overall price trend over longer periods. Once the main trend is identified on the higher time frame, you can switch to a lower time frame to look for entry opportunities that align with that trend.
In the chart below, the Daily chart of USD/JPY for February shows that the price is moving below the 50-period moving average, after previously failing to stay above it. At the same time, the Stochastic indicator is below the 20 level, with the K line positioned below the D line. This Stochastic reading indicates that bearish sentiment is currently dominating the market.
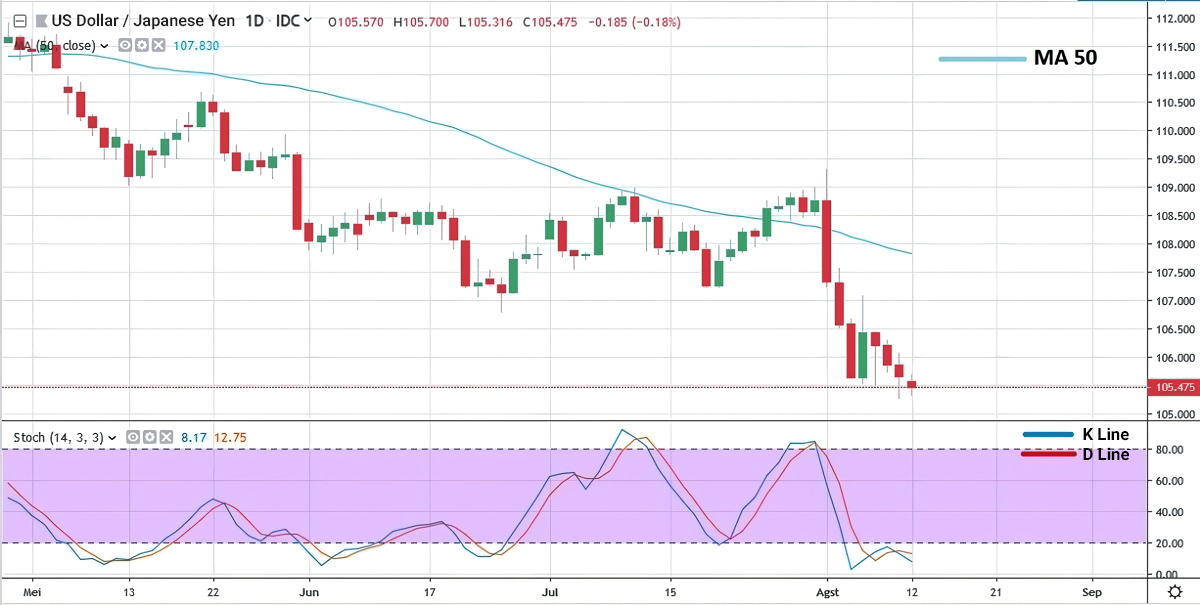
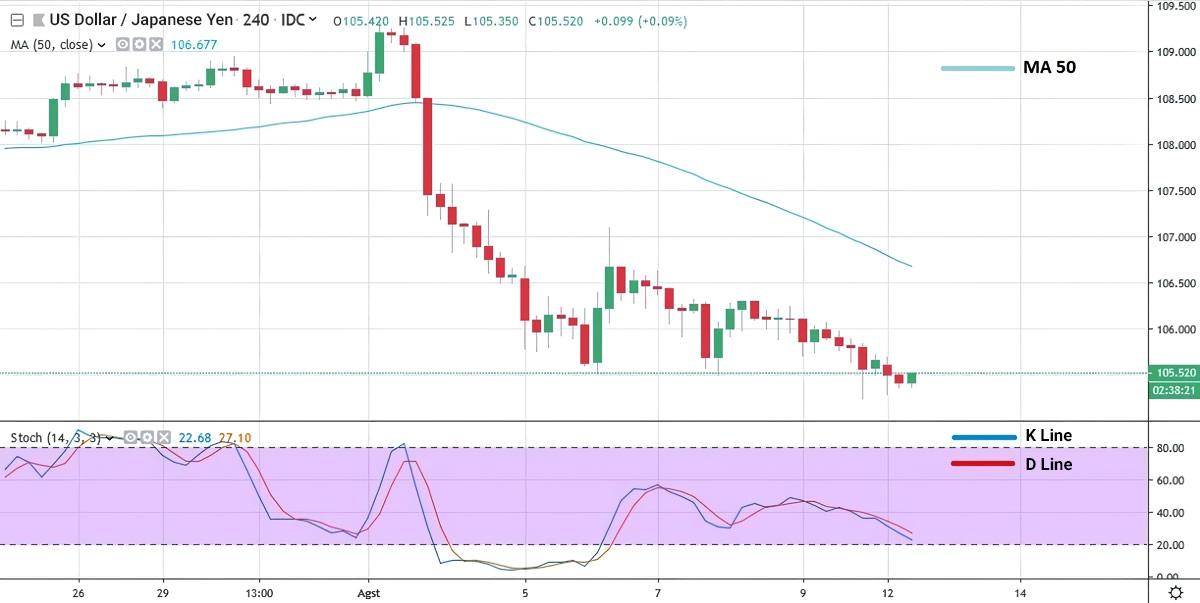
From the Daily time frame, it is clear that USD/JPY is showing signs of weakness. With this information, the next step is to wait for suitable sell opportunities. On the 4-hour chart, USD/JPY also continues to form a downtrend. When the Stochastic indicator reaches the 80 area, this can be considered a potential setup point to prepare for a sell entry.
In simple terms, multiple time frame analysis uses a higher time frame to identify the main trend, while a lower time frame is used to pinpoint entry points. When both time frames are aligned, traders can confidently open positions that follow the prevailing market direction.
Beyond trend analysis, selecting the right time frame is closely linked to your trading style, whether you prefer scalping, day trading, or swing trading. A more detailed explanation of this topic can be found in the article Choosing Time Frames in Forex Technical Analysis.